The growth of many natural populations depends on the
population’s density. When the population is low, its
growth is high. As the population grows, there is more
competition for food, predators become more abundant, and its
growth slows. A quantity called the carrying capacity is
the maximum density that a particular habitat can sustain. For
sparse populations, growth is often proportional to the density,
and for populations close to the carrying capacity, growth is
roughly proportional to the difference between the carrying
capacity and the population.
If C is the carrying capacity, and k is a
constant of proportionality representing the population’s
growth rate when the population density is very low, one way to
summarize the above is the equation,
 (equation 1)
where N is the population density at time t,
and  is the rate of change in the population density. Observe that
when N is small, then approximately,

because N is much smaller than C. Hence,
there is exponential growth for small N. However, as
N increases toward C, the growth rate
diminishes and when N is close to C, we have,
approximately,

which approaches zero as N approaches C.
Thus equation (1) satisfies the description given above. Now we
need to solve this differential equation for the population
density (N) in terms of the time (t).
Solution:
We can rearrange the equation to isolate t:

Integrating both sides,

where A is a constant.
Using algebra, we can rearrange the terms on the left side of
the equation as follows:

The left side can be integrated using the fact that

resulting in the equation

3) Finally, we solve for N to obtain
 (equation 2)
Worked example:
Suppose for bald eagles in a certain area, the carrying
capacity of the habitat is estimated to be 14.2
eagles/km2., and the rate of
growth for a sparse population is k = 40% per year. A
survey done in 1998 shows that the population density was 3.1
eagles/km2. What do you estimate
the population be in each year between 1995 and 2010 if
environmental conditions remain the same, i.e. that the carrying
capacity, C, and the growth rate, k, remain
unchanged?
Step 1: Compute the unknown constant,
A, from initial conditions.
We will measure the time in years, referring to 1998 as year
t = 0. When t = 0, equation (2)
becomes

Standard algebra yields A = -1.2755. Thus the
population density and time in years are related by
 (equation 3)
Step 2: Compute N for values of
t of interest and display the results.
For 1995, t = -3 and for 2010, t = 12.
Substitute each integer between -3 and 12 into the above equation
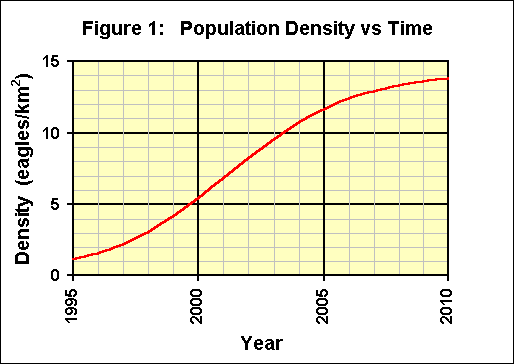
and compute N. If the information is graphed, with the
year, t + 1998, on the x-axis and the
population density, N, on the y-axis, figure 1
is the result.

When interpreting such results, remember some of the basic
assumptions:
- The carrying capacity, C, does not vary over the
period of the analysis.
- The growth rate, k, does not vary over
the period of the analysis.
- The form of the growth is adequately described by
the equation
Step 3: Discussion of the results.
Note that during the first few years when the density is much
less than the carrying capacity, the growth seems to be
exponential. As the density approaches the carrying capacity, the
growth declines and the density will not exceed the carrying
capacity.

![]() (equation 1)
(equation 1)![]() is the rate of change in the population density. Observe that
when N is small, then approximately,
is the rate of change in the population density. Observe that
when N is small, then approximately,