Biomedical Engineering
Logs & Exponents: Bode Plots
Introduction
The Bode plot is an example of logarithmic graphing used by
electrical engineers.
The voltage gain of a passive or active filter, as a function of
frequency, is non-linear. For the high pass R-C
filter, the magnitude of the voltage gain, as a function of
frequency, is expressed by the formula:

where "fc" is called the cutoff frequency and "f" is the frequency in Hertz. "Av " is the voltage gain, (in this case, a loss) for the passive filter circuit.
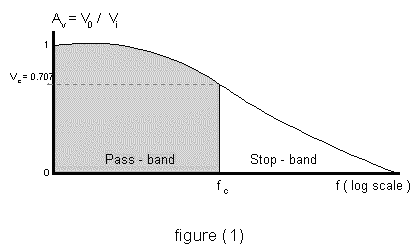
Likewise, the graph of the voltage gain for a typical low-pass R-C filter is shown in the figure (1). A logarithmic scale is used to plot the frequency along the horizontal axis.

For low frequencies, the gain of the circuit is equal to 1. This is called the pass-band region. The upper limit for the pass-band region is located at the cutoff frequency, "fc". The Bode db gain at the cutoff frequency is:

The Problem:
Given a high pass filter and R= 1.0 kΩ and C = 0.1 μF:
- Calculate the cutoff frequency.
- Calculate the Bode gain at the cutoff frequency.
- Plot the Bode gain verses frequency, in Hertz, where the
Bode gain is given by the formula:

- Sketch the straight-line approximation or "idealized Bode plot".
Solution:
- The cutoff frequency for a high-pass R-C filter is:

- The Bode gain at the cutoff frequency is:

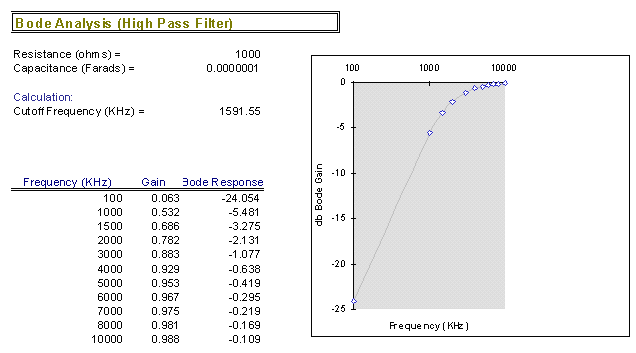
- The Bode plot versus frequency is shown below. Excel is
used to generate the data.

- The idealized Bode plot is obtained by considering the Bode
gain:

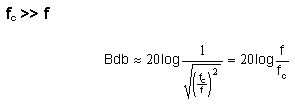
The following approximations can be made:
Case (i):

The Bode gain in the pass-band region is zero.
Case (ii):

For the stop-band region, the Bode gain is a straight line with slope equal to 20 db per decade. The Bode gain is negative, intersecting with the pass-band approximation at the cutoff frequency.
Written by Ross Bradbeer, September 24, 1997